EETC. OCUPADOS.SERV: ACTIV.PROFESIONALES,ADMINISTRATIVAS,AUXILIARES.
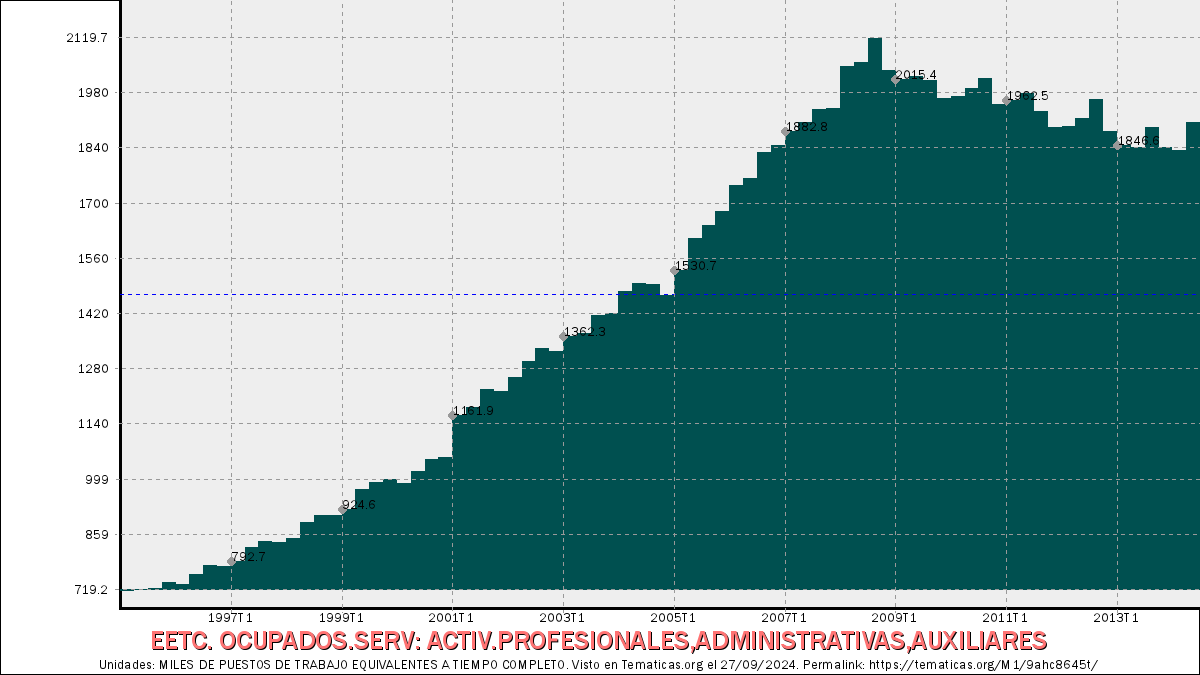
EETC. OCUPADOS.SERV: ACTIV.PROFESIONALES,ADMINISTRATIVAS,AUXILIARES
1.906,1
MILES DE PUESTOS DE TRABAJO EQUIVALENTES A TIEMPO COMPLETO
Último valor de Segundo trimestre de 2014.
Indicador: EETC. OCUPADOS.SERV: ACTIV.PROFESIONALES,ADMINISTRATIVAS,AUXILIARES, en la sección de Series históricas. Contabilidad Nacional, de la categoría Contabilidad Nacional. Intervalo desde Primer trimestre de 1995 hasta Segundo trimestre de 2014.
Claves principales de la serie:
Valor más reciente (Segundo trimestre de 2014): 1.906,1 MILES DE PUESTOS DE TRABAJO EQUIVALENTES A TIEMPO COMPLETO.Valor anterior (Primer trimestre de 2014): 1.834,7 MILES DE PUESTOS DE TRABAJO EQUIVALENTES A TIEMPO COMPLETO.
Variación en los dos últimos valores: 71,4 MILES DE PUESTOS DE TRABAJO EQUIVALENTES A TIEMPO COMPLETO. (3,89 porcentualmente).
Valor más alto alcanzado en Tercer trimestre de 2008: 2.119,7 MILES DE PUESTOS DE TRABAJO EQUIVALENTES A TIEMPO COMPLETO.
Valor más bajo alcanzado en Primer trimestre de 1995: 719,2 MILES DE PUESTOS DE TRABAJO EQUIVALENTES A TIEMPO COMPLETO.
Unidades: MILES DE PUESTOS DE TRABAJO EQUIVALENTES A TIEMPO COMPLETO.
Actualizada el .
Frecuencia: Trimestral.
Notas: ACTUALIZA: ÁREA MERCADO LABORAL
Fuente: INE (CN 2008).
Código: 9ahc8645t.
Tabla detallada de valores:
| EETC. OCUPADOS.SERV: ACTIV.PROFESIONALES,ADMINISTRATIVAS,AUXILIARES | ||
|---|---|---|
| Fecha | Valor (MILES DE PUESTOS DE TRABAJO EQUIVALENTES A TIEMPO COMPLETO) | Diferencia |
| Fecha | Valor (MILES DE PUESTOS DE TRABAJO EQUIVALENTES A TIEMPO COMPLETO) | Diferencia |
| Segundo trimestre de 2014 | 1.906,1 | 71,4 |
| Primer trimestre de 2014 | 1.834,7 | -8 |
| Cuarto trimestre de 2013 | 1.842,7 | -49,1 |
| Tercer trimestre de 2013 | 1.891,8 | 50,2 |
| Segundo trimestre de 2013 | 1.841,6 | -5 |
| Primer trimestre de 2013 | 1.846,6 | -36 |
| Cuarto trimestre de 2012 | 1.882,6 | -80,2 |
| Tercer trimestre de 2012 | 1.962,8 | 45,9 |
| Segundo trimestre de 2012 | 1.916,9 | 20,4 |
| Primer trimestre de 2012 | 1.896,5 | 3,5 |
| Cuarto trimestre de 2011 | 1.893 | -40,8 |
| Tercer trimestre de 2011 | 1.933,8 | -45 |
| Segundo trimestre de 2011 | 1.978,8 | 16,3 |
| Primer trimestre de 2011 | 1.962,5 | 11,1 |
| Cuarto trimestre de 2010 | 1.951,4 | -66,7 |
| Tercer trimestre de 2010 | 2.018,1 | 27,3 |
| Segundo trimestre de 2010 | 1.990,8 | 20 |
| Primer trimestre de 2010 | 1.970,8 | 3,4 |
| Cuarto trimestre de 2009 | 1.967,4 | -45,2 |
| Tercer trimestre de 2009 | 2.012,6 | -8,8 |
| Segundo trimestre de 2009 | 2.021,4 | 6 |
| Primer trimestre de 2009 | 2.015,4 | -23,3 |
| Cuarto trimestre de 2008 | 2.038,7 | -81 |
| Tercer trimestre de 2008 | 2.119,7 | 61 |
| Segundo trimestre de 2008 | 2.058,7 | 10,9 |
| Primer trimestre de 2008 | 2.047,8 | 105,7 |
| Cuarto trimestre de 2007 | 1.942,1 | 2,5 |
| Tercer trimestre de 2007 | 1.939,6 | 34,1 |
| Segundo trimestre de 2007 | 1.905,5 | 22,7 |
| Primer trimestre de 2007 | 1.882,8 | 36,2 |
| Cuarto trimestre de 2006 | 1.846,6 | 16,4 |
| … | ||