EETC. ASALARIADOS. SERV: ACTIV.PROFESIONALES,ADMINISTRATIVAS,AUXILIARES(CVEC).
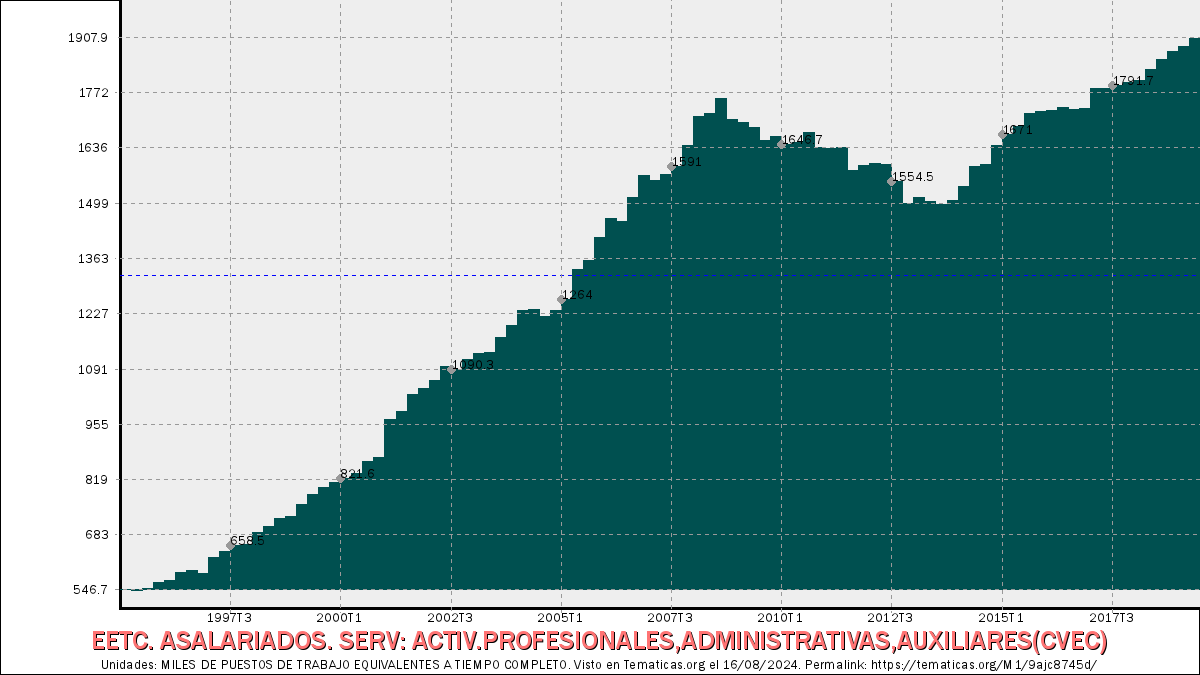
EETC. ASALARIADOS. SERV: ACTIV.PROFESIONALES,ADMINISTRATIVAS,AUXILIARES(CVEC)
1.907,9
MILES DE PUESTOS DE TRABAJO EQUIVALENTES A TIEMPO COMPLETO
Último valor de Segundo trimestre de 2019.
Indicador: EETC. ASALARIADOS. SERV: ACTIV.PROFESIONALES,ADMINISTRATIVAS,AUXILIARES(CVEC), en la sección de Series históricas. Contabilidad Nacional, de la categoría Contabilidad Nacional. Intervalo desde Primer trimestre de 1995 hasta Segundo trimestre de 2019.
Claves principales de la serie:
Valor más reciente (Segundo trimestre de 2019): 1.907,9 MILES DE PUESTOS DE TRABAJO EQUIVALENTES A TIEMPO COMPLETO.Valor anterior (Primer trimestre de 2019): 1.886,4 MILES DE PUESTOS DE TRABAJO EQUIVALENTES A TIEMPO COMPLETO.
Variación en los dos últimos valores: 21,5 MILES DE PUESTOS DE TRABAJO EQUIVALENTES A TIEMPO COMPLETO. (1,14 porcentualmente).
Valor más alto alcanzado en Segundo trimestre de 2019: 1.907,9 MILES DE PUESTOS DE TRABAJO EQUIVALENTES A TIEMPO COMPLETO.
Valor más bajo alcanzado en Segundo trimestre de 1995: 546,7 MILES DE PUESTOS DE TRABAJO EQUIVALENTES A TIEMPO COMPLETO.
Unidades: MILES DE PUESTOS DE TRABAJO EQUIVALENTES A TIEMPO COMPLETO.
Actualizada el .
Frecuencia: Trimestral.
Notas: CVEC DE EFECTOS ESTACIONALES Y CALENDARIO ACTUALIZA: ÁREA MERCADO LABORAL
Fuente: INE (CNTR BASE 2010).
Código: 9ajc8745d.
Tabla detallada de valores:
| EETC. ASALARIADOS. SERV: ACTIV.PROFESIONALES,ADMINISTRATIVAS,AUXILIARES(CVEC) | ||
|---|---|---|
| Fecha | Valor (MILES DE PUESTOS DE TRABAJO EQUIVALENTES A TIEMPO COMPLETO) | Diferencia |
| Fecha | Valor (MILES DE PUESTOS DE TRABAJO EQUIVALENTES A TIEMPO COMPLETO) | Diferencia |
| Segundo trimestre de 2019 | 1.907,9 | 21,5 |
| Primer trimestre de 2019 | 1.886,4 | 10,6 |
| Cuarto trimestre de 2018 | 1.875,8 | 20 |
| Tercer trimestre de 2018 | 1.855,8 | 24,1 |
| Segundo trimestre de 2018 | 1.831,7 | 28,4 |
| Primer trimestre de 2018 | 1.803,3 | 4,4 |
| Cuarto trimestre de 2017 | 1.798,9 | 7,2 |
| Tercer trimestre de 2017 | 1.791,7 | 9 |
| Segundo trimestre de 2017 | 1.782,7 | -2,1 |
| Primer trimestre de 2017 | 1.784,8 | 51,5 |
| Cuarto trimestre de 2016 | 1.733,3 | 2,4 |
| Tercer trimestre de 2016 | 1.730,9 | -7,2 |
| Segundo trimestre de 2016 | 1.738,1 | 9,3 |
| Primer trimestre de 2016 | 1.728,8 | 1,9 |
| Cuarto trimestre de 2015 | 1.726,9 | 6 |
| Tercer trimestre de 2015 | 1.720,9 | 30,5 |
| Segundo trimestre de 2015 | 1.690,4 | 19,4 |
| Primer trimestre de 2015 | 1.671 | 28,3 |
| Cuarto trimestre de 2014 | 1.642,7 | 47,2 |
| Tercer trimestre de 2014 | 1.595,5 | 4,2 |
| Segundo trimestre de 2014 | 1.591,3 | 48 |
| Primer trimestre de 2014 | 1.543,3 | 34,8 |
| Cuarto trimestre de 2013 | 1.508,5 | 9,9 |
| Tercer trimestre de 2013 | 1.498,6 | -7,3 |
| Segundo trimestre de 2013 | 1.505,9 | -8 |
| Primer trimestre de 2013 | 1.513,9 | 12,6 |
| Cuarto trimestre de 2012 | 1.501,3 | -53,2 |
| Tercer trimestre de 2012 | 1.554,5 | -41,2 |
| Segundo trimestre de 2012 | 1.595,7 | -2,4 |
| Primer trimestre de 2012 | 1.598,1 | 3,9 |
| Cuarto trimestre de 2011 | 1.594,2 | 11,6 |
| … | ||