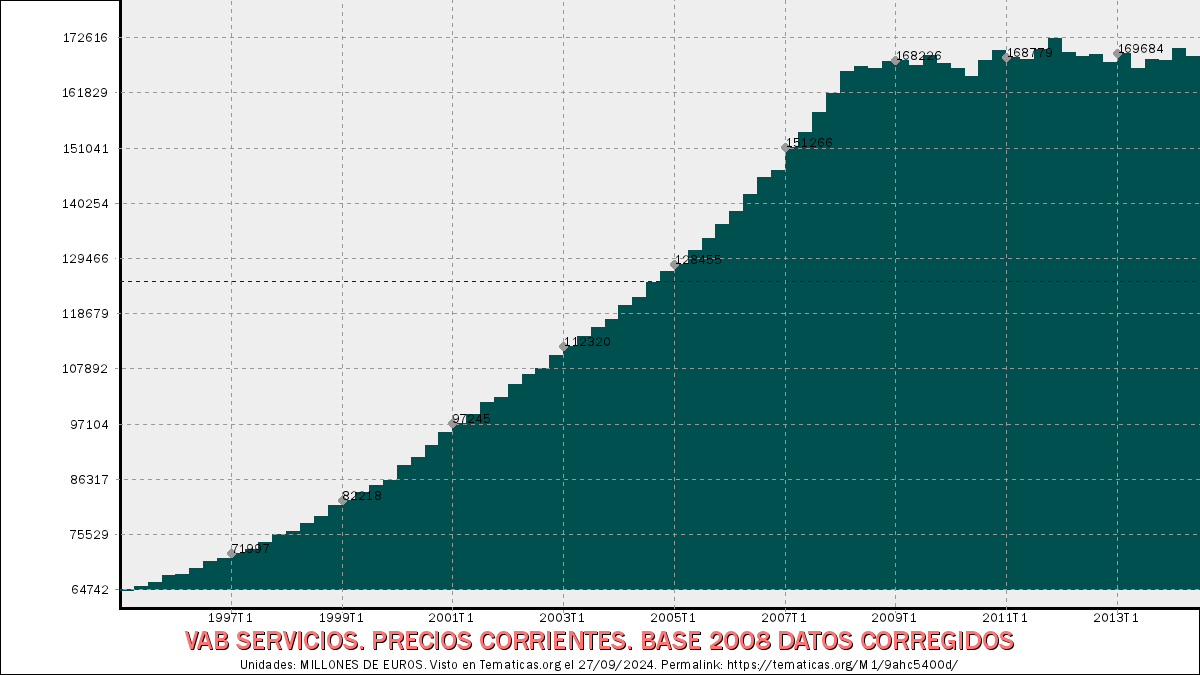
VAB SERVICIOS. PRECIOS CORRIENTES. BASE 2008 DATOS CORREGIDOS.
VAB SERVICIOS. PRECIOS CORRIENTES. BASE 2008 DATOS…
169.072
MILLONES DE EUROS
Último valor de Segundo trimestre de 2014.
Indicador: VAB SERVICIOS. PRECIOS CORRIENTES. BASE 2008 DATOS CORREGIDOS, en la sección de Series históricas. Contabilidad Nacional, de la categoría Contabilidad Nacional. Intervalo desde Primer trimestre de 1995 hasta Segundo trimestre de 2014.
Claves principales de la serie:
Valor más reciente (Segundo trimestre de 2014): 169.072 MILLONES DE EUROS.Valor anterior (Primer trimestre de 2014): 170.615 MILLONES DE EUROS.
Variación en los dos últimos valores: -1.543 MILLONES DE EUROS. (-0,9 porcentualmente).
Valor más alto alcanzado en Cuarto trimestre de 2011: 172.616 MILLONES DE EUROS.
Valor más bajo alcanzado en Primer trimestre de 1995: 64.742 MILLONES DE EUROS.
Unidades: MILLONES DE EUROS.
Actualizada el .
Frecuencia: Trimestral.
Notas: NOTA: DATOS CORREGIDOS DE EFECTOS ESTACIONALES Y DE CALENDARIO ACTUALIZA: AREA COYUNTURA ECONOMICA
Fuente: INSTITUTO NACIONAL DE ESTADISTICA (CONTABILIDAD NACIONAL TRIMESTRAL-BASE 2008).
Código: 9ahc5400d.
Tabla detallada de valores:
| VAB SERVICIOS. PRECIOS CORRIENTES. BASE 2008 DATOS CORREGIDOS | ||
|---|---|---|
| Fecha | Valor (MILLONES DE EUROS) | Diferencia |
| Fecha | Valor (MILLONES DE EUROS) | Diferencia |
| Segundo trimestre de 2014 | 169.072 | -1.543 |
| Primer trimestre de 2014 | 170.615 | 2.425 |
| Cuarto trimestre de 2013 | 168.190 | -211 |
| Tercer trimestre de 2013 | 168.401 | 1.776 |
| Segundo trimestre de 2013 | 166.625 | -3.059 |
| Primer trimestre de 2013 | 169.684 | 1.864 |
| Cuarto trimestre de 2012 | 167.820 | -1.687 |
| Tercer trimestre de 2012 | 169.507 | 412 |
| Segundo trimestre de 2012 | 169.095 | -783 |
| Primer trimestre de 2012 | 169.878 | -2.738 |
| Cuarto trimestre de 2011 | 172.616 | 2.310 |
| Tercer trimestre de 2011 | 170.306 | 1.805 |
| Segundo trimestre de 2011 | 168.501 | -278 |
| Primer trimestre de 2011 | 168.779 | -1.395 |
| Cuarto trimestre de 2010 | 170.174 | 2.023 |
| Tercer trimestre de 2010 | 168.151 | 3.095 |
| Segundo trimestre de 2010 | 165.056 | -1.699 |
| Primer trimestre de 2010 | 166.755 | -955 |
| Cuarto trimestre de 2009 | 167.710 | -1.537 |
| Tercer trimestre de 2009 | 169.247 | 2.025 |
| Segundo trimestre de 2009 | 167.222 | -1.004 |
| Primer trimestre de 2009 | 168.226 | 261 |
| Cuarto trimestre de 2008 | 167.965 | 1.366 |
| Tercer trimestre de 2008 | 166.599 | -427 |
| Segundo trimestre de 2008 | 167.026 | 857 |
| Primer trimestre de 2008 | 166.169 | 4.449 |
| Cuarto trimestre de 2007 | 161.720 | 3.649 |
| Tercer trimestre de 2007 | 158.071 | 3.925 |
| Segundo trimestre de 2007 | 154.146 | 2.880 |
| Primer trimestre de 2007 | 151.266 | 4.483 |
| Cuarto trimestre de 2006 | 146.783 | 1.311 |
| … | ||