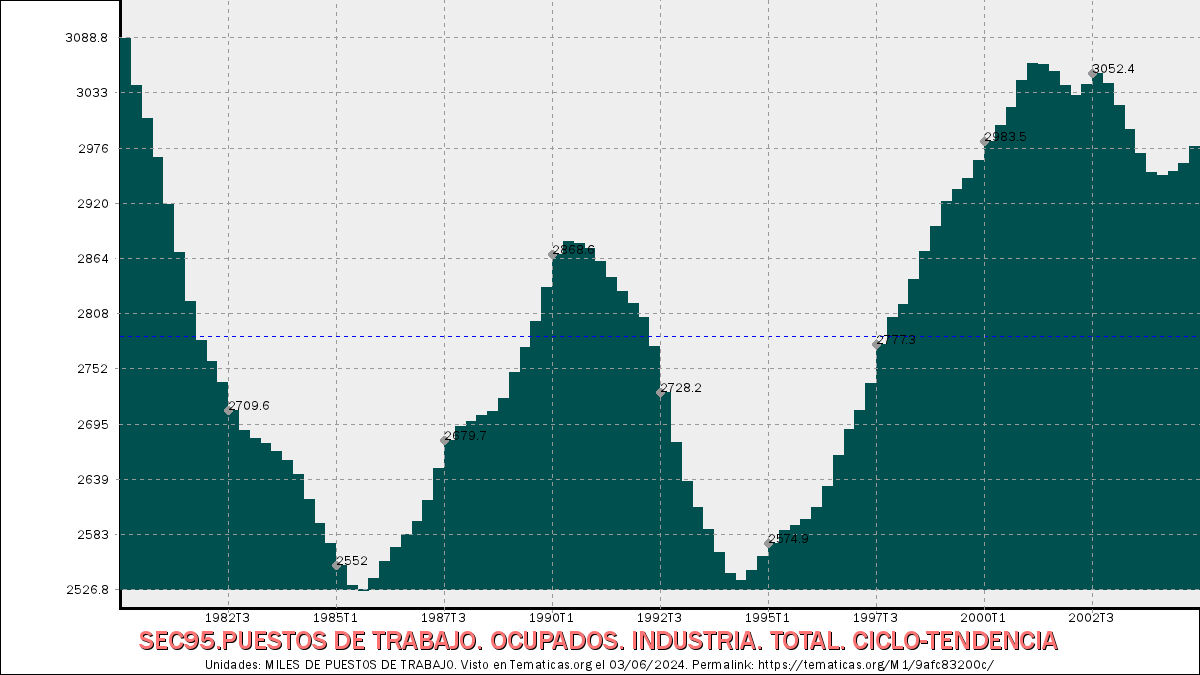
SEC95.PUESTOS DE TRABAJO. OCUPADOS. INDUSTRIA. TOTAL. CICLO-TENDENCIA.
SEC95.PUESTOS DE TRABAJO. OCUPADOS. INDUSTRIA. TOTAL.…
2.978,2
MILES DE PUESTOS DE TRABAJO
Último valor de Cuarto trimestre de 2004.
Indicador: SEC95.PUESTOS DE TRABAJO. OCUPADOS. INDUSTRIA. TOTAL. CICLO-TENDENCIA, en la sección de Series históricas. Contabilidad Nacional, de la categoría Contabilidad Nacional. Intervalo desde Primer trimestre de 1980 hasta Cuarto trimestre de 2004.
Claves principales de la serie:
Valor más reciente (Cuarto trimestre de 2004): 2.978,2 MILES DE PUESTOS DE TRABAJO.Valor anterior (Tercer trimestre de 2004): 2.961,5 MILES DE PUESTOS DE TRABAJO.
Variación en los dos últimos valores: 16,7 MILES DE PUESTOS DE TRABAJO. (0,56 porcentualmente).
Valor más alto alcanzado en Primer trimestre de 1980: 3.088,8 MILES DE PUESTOS DE TRABAJO.
Valor más bajo alcanzado en Tercer trimestre de 1985: 2.526,8 MILES DE PUESTOS DE TRABAJO.
Unidades: MILES DE PUESTOS DE TRABAJO.
Actualizada el .
Frecuencia: Trimestral.
Notas: ACTUALIZA: AREA MERCADO LABORAL
Fuente: INE (SEC 95).
Código: 9afc83200c.
Tabla detallada de valores:
| SEC95.PUESTOS DE TRABAJO. OCUPADOS. INDUSTRIA. TOTAL. CICLO-TENDENCIA | ||
|---|---|---|
| Fecha | Valor (MILES DE PUESTOS DE TRABAJO) | Diferencia |
| Fecha | Valor (MILES DE PUESTOS DE TRABAJO) | Diferencia |
| Cuarto trimestre de 2004 | 2.978,2 | 16,7 |
| Tercer trimestre de 2004 | 2.961,5 | 8,2 |
| Segundo trimestre de 2004 | 2.953,3 | 4,3 |
| Primer trimestre de 2004 | 2.949 | -2,8 |
| Cuarto trimestre de 2003 | 2.951,8 | -19,5 |
| Tercer trimestre de 2003 | 2.971,3 | -24,2 |
| Segundo trimestre de 2003 | 2.995,5 | -24,6 |
| Primer trimestre de 2003 | 3.020,1 | -22,6 |
| Cuarto trimestre de 2002 | 3.042,7 | -9,7 |
| Tercer trimestre de 2002 | 3.052,4 | 10,3 |
| Segundo trimestre de 2002 | 3.042,1 | 11,7 |
| Primer trimestre de 2002 | 3.030,4 | -9,7 |
| Cuarto trimestre de 2001 | 3.040,1 | -14,6 |
| Tercer trimestre de 2001 | 3.054,7 | -7,7 |
| Segundo trimestre de 2001 | 3.062,4 | -0,5 |
| Primer trimestre de 2001 | 3.062,9 | 17,6 |
| Cuarto trimestre de 2000 | 3.045,3 | 26,7 |
| Tercer trimestre de 2000 | 3.018,6 | 18,8 |
| Segundo trimestre de 2000 | 2.999,8 | 16,3 |
| Primer trimestre de 2000 | 2.983,5 | 19,3 |
| Cuarto trimestre de 1999 | 2.964,2 | 18,1 |
| Tercer trimestre de 1999 | 2.946,1 | 10,9 |
| Segundo trimestre de 1999 | 2.935,2 | 13,1 |
| Primer trimestre de 1999 | 2.922,1 | 25,1 |
| Cuarto trimestre de 1998 | 2.897 | 25,6 |
| Tercer trimestre de 1998 | 2.871,4 | 28 |
| Segundo trimestre de 1998 | 2.843,4 | 25,2 |
| Primer trimestre de 1998 | 2.818,2 | 13,6 |
| Cuarto trimestre de 1997 | 2.804,6 | 27,3 |
| Tercer trimestre de 1997 | 2.777,3 | 39,7 |
| Segundo trimestre de 1997 | 2.737,6 | 28,2 |
| … | ||