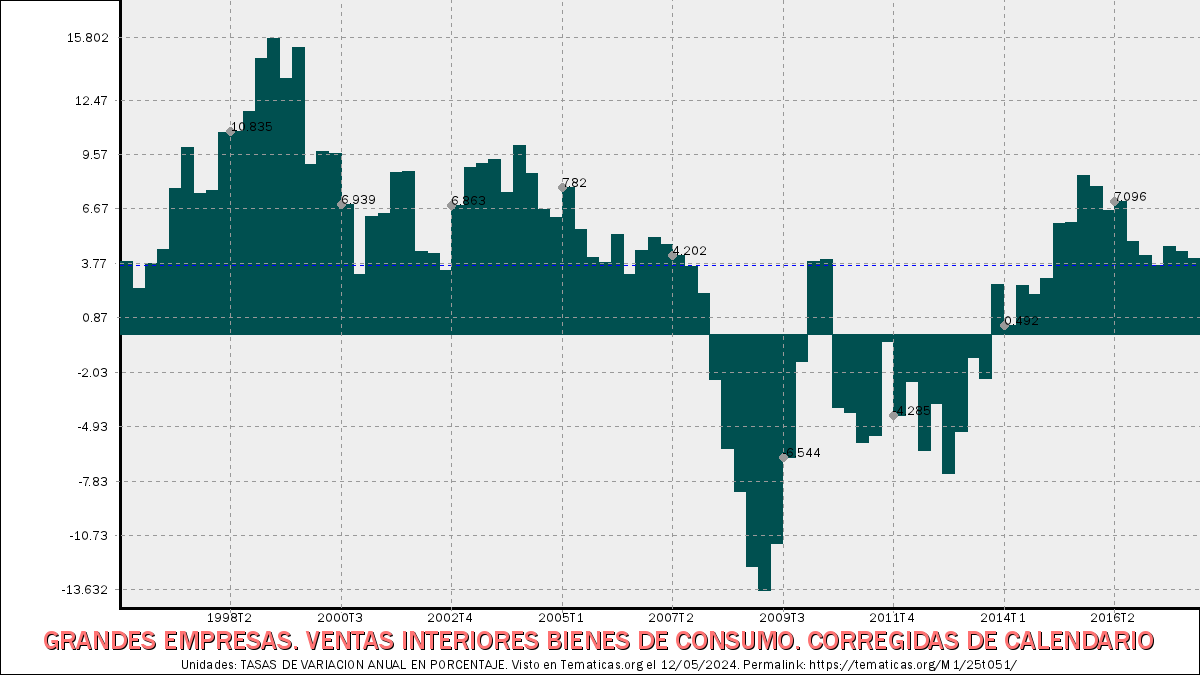
GRANDES EMPRESAS. VENTAS INTERIORES BIENES DE CONSUMO. CORREGIDAS DE CALENDARIO.
GRANDES EMPRESAS. VENTAS INTERIORES BIENES DE CONSUMO.…
4,032
TASAS DE VARIACION ANUAL EN PORCENTAJE
Último valor de Cuarto trimestre de 2017.
Indicador: GRANDES EMPRESAS. VENTAS INTERIORES BIENES DE CONSUMO. CORREGIDAS DE CALENDARIO, en la sección de Otros indicadores de actividad, de la categoría Indicadores de Producción y Demanda Nacional. Intervalo desde Primer trimestre de 1996 hasta Cuarto trimestre de 2017.
Claves principales de la serie:
Valor más reciente (Cuarto trimestre de 2017): 4,032.Valor anterior (Tercer trimestre de 2017): 4,424.
Variación en los dos últimos valores: -0,39. (-8,86 porcentualmente).
Valor más alto alcanzado en Primer trimestre de 1999: 15,802.
Valor más bajo alcanzado en Primer trimestre de 2009: -13,632.
Unidades: TASAS DE VARIACION ANUAL EN PORCENTAJE.
Actualizada el .
Frecuencia: Trimestral.
Notas: ACTUALIZA: SGACPE (AREA COYUNTURA NACIONAL) NOTA: DATOS A POBLACION CONSTANTE. SERIES OBTENIDAS DE LA LIQUIDACION MENSUAL DE LAS RETENCIONES DEL TRABAJO, IVA, IMPUESTOS ESPECIALES Y PRIMAS DE SEGUROS DE LAS GRANDES EMPRESAS.
Fuente: AEAT (AGENCIA ESTATAL DE ADMINISTRACION TRIBUTARIA).
Código: 25t051.
Tabla detallada de valores:
| GRANDES EMPRESAS. VENTAS INTERIORES BIENES DE CONSUMO. CORREGIDAS DE CALENDARIO | ||
|---|---|---|
| Fecha | Valor (TASAS DE VARIACION ANUAL EN PORCENTAJE) | Diferencia |
| Fecha | Valor (TASAS DE VARIACION ANUAL EN PORCENTAJE) | Diferencia |
| Cuarto trimestre de 2017 | 4,032 | -0,392 |
| Tercer trimestre de 2017 | 4,424 | -0,281 |
| Segundo trimestre de 2017 | 4,705 | 1,044 |
| Primer trimestre de 2017 | 3,661 | -0,536 |
| Cuarto trimestre de 2016 | 4,197 | -0,778 |
| Tercer trimestre de 2016 | 4,975 | -2,121 |
| Segundo trimestre de 2016 | 7,096 | 0,495 |
| Primer trimestre de 2016 | 6,601 | -1,302 |
| Cuarto trimestre de 2015 | 7,903 | -0,561 |
| Tercer trimestre de 2015 | 8,464 | 2,512 |
| Segundo trimestre de 2015 | 5,952 | 0,057 |
| Primer trimestre de 2015 | 5,895 | 2,93 |
| Cuarto trimestre de 2014 | 2,965 | 0,848 |
| Tercer trimestre de 2014 | 2,117 | -0,509 |
| Segundo trimestre de 2014 | 2,626 | 2,134 |
| Primer trimestre de 2014 | 0,492 | -2,152 |
| Cuarto trimestre de 2013 | 2,644 | 4,962 |
| Tercer trimestre de 2013 | -2,318 | -1,075 |
| Segundo trimestre de 2013 | -1,243 | 3,93 |
| Primer trimestre de 2013 | -5,173 | 2,239 |
| Cuarto trimestre de 2012 | -7,412 | -3,727 |
| Tercer trimestre de 2012 | -3,685 | 2,481 |
| Segundo trimestre de 2012 | -6,166 | -3,666 |
| Primer trimestre de 2012 | -2,5 | 1,785 |
| Cuarto trimestre de 2011 | -4,285 | -3,903 |
| Tercer trimestre de 2011 | -0,382 | 5,009 |
| Segundo trimestre de 2011 | -5,391 | 0,376 |
| Primer trimestre de 2011 | -5,767 | -1,625 |
| Cuarto trimestre de 2010 | -4,142 | -0,262 |
| Tercer trimestre de 2010 | -3,88 | -7,899 |
| Segundo trimestre de 2010 | 4,019 | 0,146 |
| … | ||