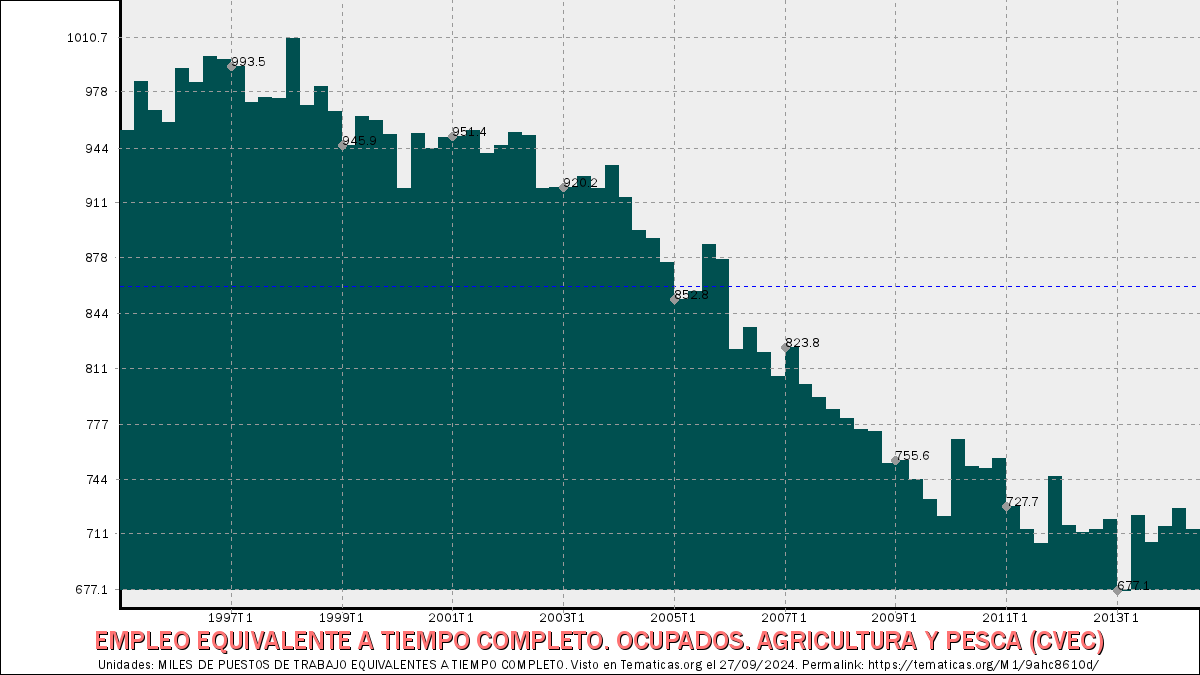
EMPLEO EQUIVALENTE A TIEMPO COMPLETO. OCUPADOS. AGRICULTURA Y PESCA (CVEC).
EMPLEO EQUIVALENTE A TIEMPO COMPLETO. OCUPADOS. AGRICULTURA…
714,1
MILES DE PUESTOS DE TRABAJO EQUIVALENTES A TIEMPO COMPLETO
Último valor de Segundo trimestre de 2014.
Indicador: EMPLEO EQUIVALENTE A TIEMPO COMPLETO. OCUPADOS. AGRICULTURA Y PESCA (CVEC), en la sección de Series históricas. Contabilidad Nacional, de la categoría Contabilidad Nacional. Intervalo desde Primer trimestre de 1995 hasta Segundo trimestre de 2014.
Claves principales de la serie:
Valor más reciente (Segundo trimestre de 2014): 714,1 MILES DE PUESTOS DE TRABAJO EQUIVALENTES A TIEMPO COMPLETO.Valor anterior (Primer trimestre de 2014): 726,7 MILES DE PUESTOS DE TRABAJO EQUIVALENTES A TIEMPO COMPLETO.
Variación en los dos últimos valores: -12,6 MILES DE PUESTOS DE TRABAJO EQUIVALENTES A TIEMPO COMPLETO. (-1,73 porcentualmente).
Valor más alto alcanzado en Primer trimestre de 1998: 1.010,7 MILES DE PUESTOS DE TRABAJO EQUIVALENTES A TIEMPO COMPLETO.
Valor más bajo alcanzado en Primer trimestre de 2013: 677,1 MILES DE PUESTOS DE TRABAJO EQUIVALENTES A TIEMPO COMPLETO.
Unidades: MILES DE PUESTOS DE TRABAJO EQUIVALENTES A TIEMPO COMPLETO.
Actualizada el .
Frecuencia: Trimestral.
Notas: CVEC DE EFECTOS ESTACIONALES Y CALENDARIO ACTUALIZA: ÁREA MERCADO LABORAL
Fuente: INE (CN 2008).
Código: 9ahc8610d.
Tabla detallada de valores:
| EMPLEO EQUIVALENTE A TIEMPO COMPLETO. OCUPADOS. AGRICULTURA Y PESCA (CVEC) | ||
|---|---|---|
| Fecha | Valor (MILES DE PUESTOS DE TRABAJO EQUIVALENTES A TIEMPO COMPLETO) | Diferencia |
| Fecha | Valor (MILES DE PUESTOS DE TRABAJO EQUIVALENTES A TIEMPO COMPLETO) | Diferencia |
| Segundo trimestre de 2014 | 714,1 | -12,6 |
| Primer trimestre de 2014 | 726,7 | 11,3 |
| Cuarto trimestre de 2013 | 715,4 | 9,4 |
| Tercer trimestre de 2013 | 706 | -16,2 |
| Segundo trimestre de 2013 | 722,2 | 45,1 |
| Primer trimestre de 2013 | 677,1 | -42,9 |
| Cuarto trimestre de 2012 | 720 | 6,2 |
| Tercer trimestre de 2012 | 713,8 | 1,7 |
| Segundo trimestre de 2012 | 712,1 | -4,1 |
| Primer trimestre de 2012 | 716,2 | -29,6 |
| Cuarto trimestre de 2011 | 745,8 | 40,4 |
| Tercer trimestre de 2011 | 705,4 | -8,5 |
| Segundo trimestre de 2011 | 713,9 | -13,8 |
| Primer trimestre de 2011 | 727,7 | -29,2 |
| Cuarto trimestre de 2010 | 756,9 | 5,9 |
| Tercer trimestre de 2010 | 751 | -0,8 |
| Segundo trimestre de 2010 | 751,8 | -16,5 |
| Primer trimestre de 2010 | 768,3 | 46,3 |
| Cuarto trimestre de 2009 | 722 | -9,8 |
| Tercer trimestre de 2009 | 731,8 | -12 |
| Segundo trimestre de 2009 | 743,8 | -11,8 |
| Primer trimestre de 2009 | 755,6 | 1,8 |
| Cuarto trimestre de 2008 | 753,8 | -19,5 |
| Tercer trimestre de 2008 | 773,3 | -1 |
| Segundo trimestre de 2008 | 774,3 | -6,6 |
| Primer trimestre de 2008 | 780,9 | -5,3 |
| Cuarto trimestre de 2007 | 786,2 | -7,3 |
| Tercer trimestre de 2007 | 793,5 | -7,7 |
| Segundo trimestre de 2007 | 801,2 | -22,6 |
| Primer trimestre de 2007 | 823,8 | 17,8 |
| Cuarto trimestre de 2006 | 806 | -15 |
| … | ||