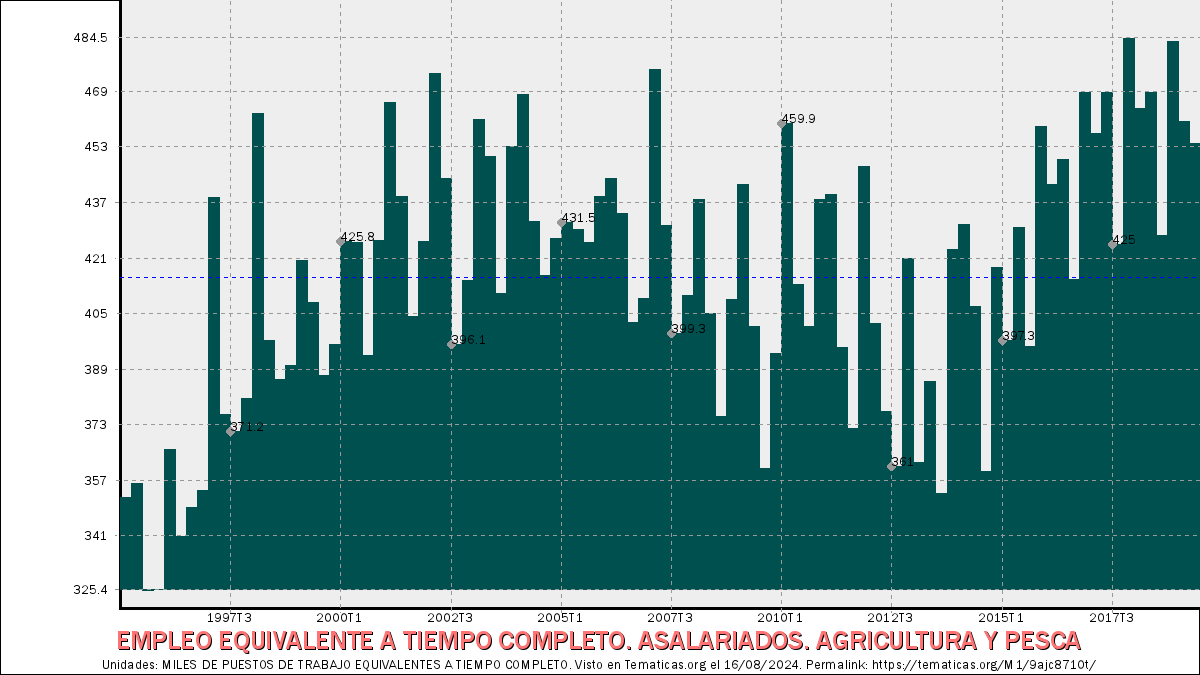
EMPLEO EQUIVALENTE A TIEMPO COMPLETO. ASALARIADOS. AGRICULTURA Y PESCA.
EMPLEO EQUIVALENTE A TIEMPO COMPLETO. ASALARIADOS.…
454,1
MILES DE PUESTOS DE TRABAJO EQUIVALENTES A TIEMPO COMPLETO
Último valor de Segundo trimestre de 2019.
Indicador: EMPLEO EQUIVALENTE A TIEMPO COMPLETO. ASALARIADOS. AGRICULTURA Y PESCA, en la sección de Series históricas. Contabilidad Nacional, de la categoría Contabilidad Nacional. Intervalo desde Primer trimestre de 1995 hasta Segundo trimestre de 2019.
Claves principales de la serie:
Valor más reciente (Segundo trimestre de 2019): 454,1 MILES DE PUESTOS DE TRABAJO EQUIVALENTES A TIEMPO COMPLETO.Valor anterior (Primer trimestre de 2019): 460,5 MILES DE PUESTOS DE TRABAJO EQUIVALENTES A TIEMPO COMPLETO.
Variación en los dos últimos valores: -6,4 MILES DE PUESTOS DE TRABAJO EQUIVALENTES A TIEMPO COMPLETO. (-1,39 porcentualmente).
Valor más alto alcanzado en Cuarto trimestre de 2017: 484,5 MILES DE PUESTOS DE TRABAJO EQUIVALENTES A TIEMPO COMPLETO.
Valor más bajo alcanzado en Tercer trimestre de 1995: 325,4 MILES DE PUESTOS DE TRABAJO EQUIVALENTES A TIEMPO COMPLETO.
Unidades: MILES DE PUESTOS DE TRABAJO EQUIVALENTES A TIEMPO COMPLETO.
Actualizada el .
Frecuencia: Trimestral.
Notas: ACTUALIZA: ÁREA MERCADO LABORAL
Fuente: INE (CNTR BASE 2010).
Código: 9ajc8710t.
Tabla detallada de valores:
| EMPLEO EQUIVALENTE A TIEMPO COMPLETO. ASALARIADOS. AGRICULTURA Y PESCA | ||
|---|---|---|
| Fecha | Valor (MILES DE PUESTOS DE TRABAJO EQUIVALENTES A TIEMPO COMPLETO) | Diferencia |
| Fecha | Valor (MILES DE PUESTOS DE TRABAJO EQUIVALENTES A TIEMPO COMPLETO) | Diferencia |
| Segundo trimestre de 2019 | 454,1 | -6,4 |
| Primer trimestre de 2019 | 460,5 | -22,9 |
| Cuarto trimestre de 2018 | 483,4 | 55,9 |
| Tercer trimestre de 2018 | 427,5 | -41,2 |
| Segundo trimestre de 2018 | 468,7 | 4,4 |
| Primer trimestre de 2018 | 464,3 | -20,2 |
| Cuarto trimestre de 2017 | 484,5 | 59,5 |
| Tercer trimestre de 2017 | 425 | -43,9 |
| Segundo trimestre de 2017 | 468,9 | 12 |
| Primer trimestre de 2017 | 456,9 | -11,8 |
| Cuarto trimestre de 2016 | 468,7 | 53,7 |
| Tercer trimestre de 2016 | 415 | -34,6 |
| Segundo trimestre de 2016 | 449,6 | 7,4 |
| Primer trimestre de 2016 | 442,2 | -16,7 |
| Cuarto trimestre de 2015 | 458,9 | 63,1 |
| Tercer trimestre de 2015 | 395,8 | -34,2 |
| Segundo trimestre de 2015 | 430 | 32,7 |
| Primer trimestre de 2015 | 397,3 | -21 |
| Cuarto trimestre de 2014 | 418,3 | 58,7 |
| Tercer trimestre de 2014 | 359,6 | -47,7 |
| Segundo trimestre de 2014 | 407,3 | -23,6 |
| Primer trimestre de 2014 | 430,9 | 7,3 |
| Cuarto trimestre de 2013 | 423,6 | 70,3 |
| Tercer trimestre de 2013 | 353,3 | -32,4 |
| Segundo trimestre de 2013 | 385,7 | 23,4 |
| Primer trimestre de 2013 | 362,3 | -58,7 |
| Cuarto trimestre de 2012 | 421 | 60 |
| Tercer trimestre de 2012 | 361 | -16 |
| Segundo trimestre de 2012 | 377 | -25,3 |
| Primer trimestre de 2012 | 402,3 | -45,2 |
| Cuarto trimestre de 2011 | 447,5 | 75,5 |
| … | ||