ASALARIADOS DEL SECTOR PÚBLICO EN EMPRESAS E INSTITUCIONES PÚBLICAS.
ASALARIADOS DEL SECTOR PÚBLICO EN EMPRESAS E INSTITUCIONES…
155,9
MILES
Último valor de Cuarto trimestre de 2013.
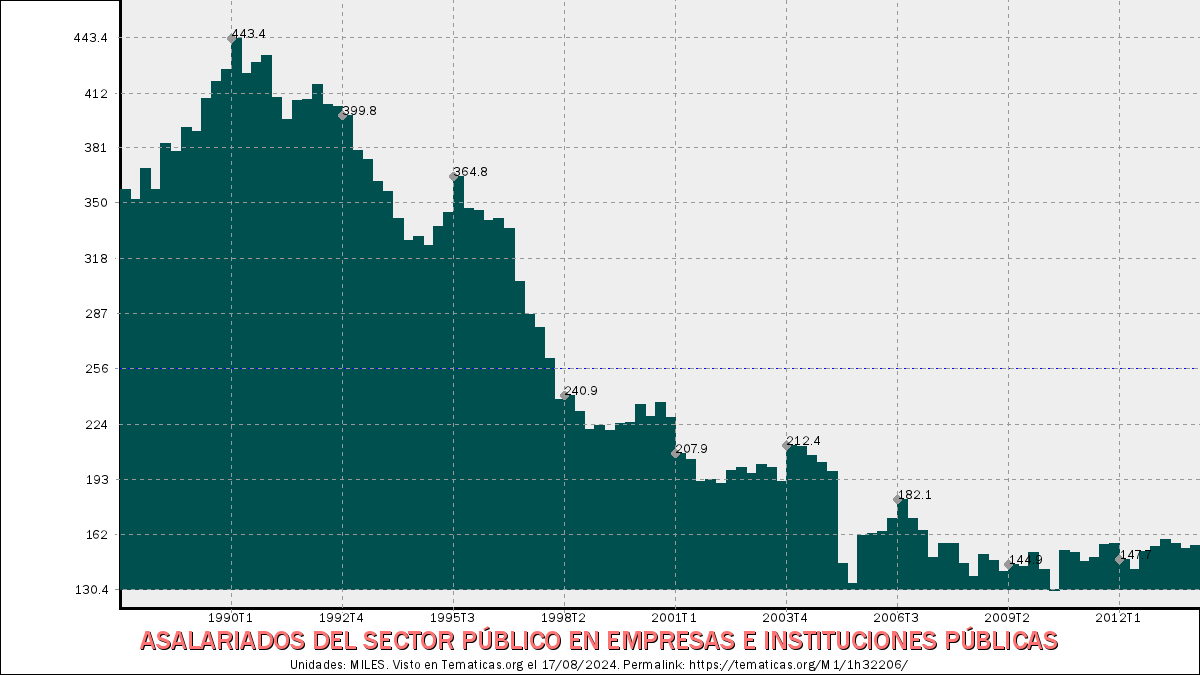
Indicador: ASALARIADOS DEL SECTOR PÚBLICO EN EMPRESAS E INSTITUCIONES PÚBLICAS, en la sección de Series históricas, de la categoría Mercado Laboral. Intervalo desde Segundo trimestre de 1987 hasta Cuarto trimestre de 2013.
Claves principales de la serie:
Valor más reciente (Cuarto trimestre de 2013): 155,9 MILES.Valor anterior (Tercer trimestre de 2013): 154,2 MILES.
Variación en los dos últimos valores: 1,7 MILES. (1,1 porcentualmente).
Valor más alto alcanzado en Primer trimestre de 1990: 443,4 MILES.
Valor más bajo alcanzado en Segundo trimestre de 2010: 130,4 MILES.
Unidades: MILES.
Actualizada el .
Frecuencia: Trimestral.
Notas: SERIE HOMOGENEIZADA POR EL INE. NUEVA PROYECCIÓN POBLACIÓN CENSO 2001 CAMBIOS DE METODOLOGÍA EN LOS PRIMEROS TRIMESTRES DE 2002 Y 2005 ACTUALIZA: ÁREA MERCADO LABORAL
Fuente: INE.
Código: 1h32206.
Tabla detallada de valores:
| ASALARIADOS DEL SECTOR PÚBLICO EN EMPRESAS E INSTITUCIONES PÚBLICAS | ||
|---|---|---|
| Fecha | Valor (MILES) | Diferencia |
| Fecha | Valor (MILES) | Diferencia |
| Cuarto trimestre de 2013 | 155,9 | 1,7 |
| Tercer trimestre de 2013 | 154,2 | -2,7 |
| Segundo trimestre de 2013 | 156,9 | -2,4 |
| Primer trimestre de 2013 | 159,3 | 4,1 |
| Cuarto trimestre de 2012 | 155,2 | 2,6 |
| Tercer trimestre de 2012 | 152,6 | 10,6 |
| Segundo trimestre de 2012 | 142 | -5,7 |
| Primer trimestre de 2012 | 147,7 | -9,4 |
| Cuarto trimestre de 2011 | 157,1 | 0,9 |
| Tercer trimestre de 2011 | 156,2 | 6,9 |
| Segundo trimestre de 2011 | 149,3 | 2,6 |
| Primer trimestre de 2011 | 146,7 | -5,4 |
| Cuarto trimestre de 2010 | 152,1 | -0,8 |
| Tercer trimestre de 2010 | 152,9 | 22,5 |
| Segundo trimestre de 2010 | 130,4 | -11,9 |
| Primer trimestre de 2010 | 142,3 | -9,5 |
| Cuarto trimestre de 2009 | 151,8 | 8 |
| Tercer trimestre de 2009 | 143,8 | -1,1 |
| Segundo trimestre de 2009 | 144,9 | 3,7 |
| Primer trimestre de 2009 | 141,2 | -6,1 |
| Cuarto trimestre de 2008 | 147,3 | -3,3 |
| Tercer trimestre de 2008 | 150,6 | 12,4 |
| Segundo trimestre de 2008 | 138,2 | -7,4 |
| Primer trimestre de 2008 | 145,6 | -11,1 |
| Cuarto trimestre de 2007 | 156,7 | -0,2 |
| Tercer trimestre de 2007 | 156,9 | 7,7 |
| Segundo trimestre de 2007 | 149,2 | -15,1 |
| Primer trimestre de 2007 | 164,3 | -6,9 |
| Cuarto trimestre de 2006 | 171,2 | -10,9 |
| Tercer trimestre de 2006 | 182,1 | 11,2 |
| Segundo trimestre de 2006 | 170,9 | 7,1 |
| … | ||